From
Projectile Unit, Activity 1...
Part II: Creating an Excel Spreadsheet
1.
Set up an Excel spreadsheet to perform trajectory calculations for you. Your
spreadsheet should look like the one farther down the page. The yellow cells are the input
cells. Once your spreadsheet is created, you should be able to type in any
"max height attained when fired vertically," and any "angle of release," and
have the rest of the values computed for you automatically.
Click here to try
out a spreadsheet created by Mr. Stapleton. The formulas in this
example are locked
and hidden, but you can change the inputs. You can also use this example
spreadsheet as a template; copy it and paste it into Excel -- and then fill in
the blanks with formulas. To create the graph, see
directions in #2, below. You should also read the "Excel Hints," below.
In case you need some help figuring out which formulas
to use, some help is given below. BUT BEFORE USING THIS RESOURCE, TRY TO SET UP
THE FORMULAS ON YOUR OWN!
a)
v0 (muzzle velocity): We’ve done this one before. Use V2
= V02 +2ad.
b)
v0x = (cosθ)muzzle velocity
c)
v0y velocity = sinθ(muzzle velocity)
d)
Total time aloft = 2(V0y)/g
e)
Total Horizontal Distance = V0x(total time aloft)
f)
Distance from origin along Y axis: since gravity is affecting motion in
the Y dimension, we have to use a kinematics formula that accounts for
acceleration. Use d=v0yt + 0.5at2. t = current time; v0y
= initial Y velocity!; a = -9.8m/s2; and d =
displacement along the y axis. In other words, d = “y position.”
g)
Distance from origin along X axis: since motion in this dimension is not
affected by gravity, vx remains constant. X position = vox(t)
Excel Hints:
- When you’re having trouble, use “help.”
- To enter a formula, use an equal sign “=” before
entering the formula.
- “*” means multiply
- Trig functions require angles in radians. To convert
45° to radians, enter the formula “=radians(45)”
- Sine = “sin” Cosine = “cos” So, to get the sine of
30°, type “=sin(radians(30))”
- There are numerous cutting and pasting hints.
One hint is to copy cells by following this procedure: 1) selecting the
cells, 2) click on and hold (don't release mouse) the dot in the
bottom right of the selected cells, and then drag that dot over adjacent cells to
which you would like to transfer the copied material.
- When you copy formulas, Excel changes cell references
for you. If a formula refers to a cell, and that formula is copied to
another cell, the referred to cell will change. It will, however,
remain in the same relative position, in relation to the cell with
the formula. For example, if you enter "=B2 + 3" into a given cell,
and then you copy that formula to the cell below your first formula, the
formula in that new cell will read "=B3+3."
- Sometimes, you will want to copy formulas, but you
will want them to always refer to one fixed cell. To override Excel's
changing of cell references, you will need to add $ symbols. For
instance, if you always want to multiply 3 by cell B4, then type "=3*$B$4."
If you copy and paste this formula, it will always say "=3*$B$4."
- If you want to type a lot of information into a cell,
but it won't all fit, horizontally (and you don't want to widen the cell),
there is a way to type the information on multiple lines within one cell.
To drop to another line, press Alt + Enter.
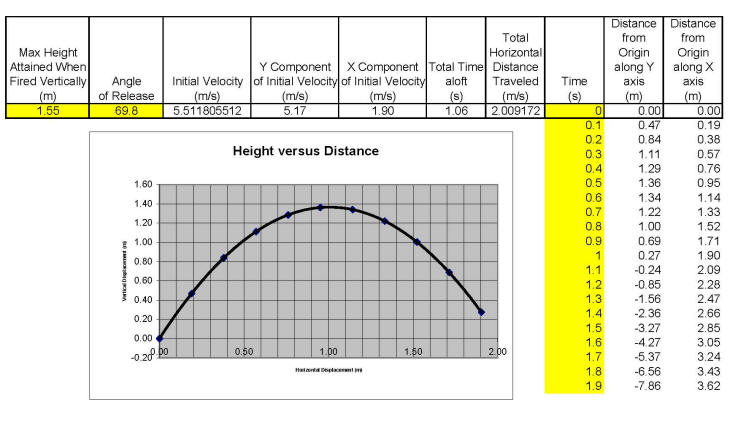
2. Create a "scatterplot"
graph of time versus position data from the spreadsheet. This will be
a parabola.
-
Create increments of time that seem
useful to you. In the example, 0.1s increments were used.
You can always change them as needed.
-
Copy your X axis and Y axis formulas
to create a table of distances from the origin for each time increment.
Keep an eye on your Y values. You don't need to go past a time
where Y becomes negative, because your projectile won't be falling
through the ground.
-
Choose "Insert Chart" from the
"insert" menu.
-
In Chart Wizard "step 1 of 4," select "XY
(Scatter)"
-
In Chart Wizard "step 2 of 4 (chart
source data)," click on the "series" tab. If you don't see "x
values" and "y values," click "Add." Next, delete any x or
y values that are already there. Then put your cursor in the "y
values". While it's there, go back to "sheet one" and drag with
your mouse to select your column of y values. After this, put your
cursor in the "x values" box and select your x values the same
way. Click "next" and continue setting up your graph.
-
Once you have a chart, select "add a
trendline" from the "chart" menu.
-
Then choose "polynomial." The
default is 2nd order, and it works for the parabolic shape of this
graph.
-
To adjust the chart (gridlines, scale,
etc.) select the chart and then choose "chart options" from the "chart"
menu.
-
When you don't know what else to do,
use the "help" menu.
3. Use your spreadsheet
to answer the following questions... When calibrating your launcher, you
find that the maximum height your projectile attains in a vertical launch is
1.55m. a) At what angle should you launch your projectile so that it
will travel 2m, horizontally, before landing? b) If this projectile
must travel through a "window" that is 0.7m higher than the launching point,
at what two horizontal distances from the origin could the window be placed?
4. Once your spreadsheet is working, save it and e-mail it to Mr.
Stapleton. State your answer to #3 in the body of your e-mail
message.